Appendix A: XML file-format of a PN model
The PN Toolbox uses an XML file for saving a model. This file is automatically generated by the PN Toolbox when the Save or Save As commands are used. It can also be edited by using any text editor, if the format described below is respected.
The root tag for the PN model is PNToolbox. The tags for global information are:
Ø
Model_name – the name of the file containing the model, including the extension “.xml”;
Ø
Type – a number that represents the PN type which can take one of the following values: 1 – untimed PN, 2 – T-timed PN, 3 – P-timed PN, 4 – stochastic PN, 5 – generalized stochastic PN;
Ø
Seed – a positive integer used to initialize the random number generator of MATLAB;
Ø
Place – the necessary information related to a place of the model, depending on the PN type;
Ø
Transition – the necessary information related to a transition of the model, depending on the PN type;
Ø
Arc – the information related to an arc of the model;
Ø
Probability – the information related to the firing probabilities set for a group of conflicting transitions, if any;
Ø
Priority – the information related to the firing priorities set for a group of conflicting transitions, if any.
The Place tag corresponding to a place in the PN model has the following structure:
•
Id – the unique identifier of the place; a string in the form “px” with “x” a distinct positive integer;
•
Value – the coordinates of the cell of the Drawing Area that contains the place (a couple of integers between 0 and 49);
•
Color – a string representing the MATLAB color used for drawing the place in the Drawing Area;
•
Label – additional information used for the graphical representation of the place:
o
Name – label of the place that is shown in the Drawing Area (any string character);
o
Offset – a couple of real values representing the offset from the default position of the label (bottom of place);
o
Visible – boolean variable corresponding to the status of the label visibility (“yes” or “no”).
•
InitialMarking – initial marking of the place;
•
Capacity – capacity of the place;
•
Time – information corresponding to the probability distribution of the time duration assigned to the place; used only in the case of P-timed PNs:
o
Distribution – name of the MATLAB distribution function;
o
Parameters – values for the parameters of the selected distribution function.
The Transition tag corresponding to a transition in the PN model has the following structure:
•
Id – the unique identifier of the transition; a string in the form “ty” with “y” a distinct positive integer;
•
Value – the coordinates of the cell of the Drawing Area that contains the transition (a couple of integers between 0 and 49);
•
Color – a string representing the MATLAB color used for drawing the transition in the Drawing Area;
•
Representation – a string indicating the type of the graphical representation for the transition in the Drawing Area, namely as Square, Horizontal Rectangle, Vertical Rectangle, Horizontal Line or Vertical Line;
•
Message – a string representing the message displayed by the PN Toolbox in the Message Box when the transition is fired;
•
Label – additional information used for the graphic representation of the transition:
o
Name – label of the transition that is shown in Drawing Area (any string character);
o
Offset – a couple of real values representing the offset from the default position of the label (bottom of transition);
o
Visible – boolean variable corresponding to the status of the label visibility (yes or no).
•
Time – information corresponding to the probability distribution of the time duration assigned to the transition; used only in the case of T-timed, stochastic and generalized stochastic PNs:
o
Distribution – name of the MATLAB distribution function;
o
Parameters – values for the parameters of the selected distribution function;
o
Marking_Dependent – boolean variable showing the dependence of the firing rate of the transition on the marking of its input places (“yes” or “no”); used only in the case of stochastic and generalized stochastic PNs.
The Arc tag corresponding to an arc in the PN model has the following structure:
•
Id – the unique identifier of the arc; a string in the form “az” with “z” a distinct positive integer;
•
From – the Id of the departure node;
•
To – the Id of the arrival node;
•
Style – arc style (1 – regular, 2 – bidirectional, 3 – inhibitor);
•
Type – type of graphical representation of the arc (1 – line, 2 – cubic spline);
•
Cubic – the coordinates in the Drawing Area of the four points defining the spline curve; used only for the arcs with type = 2;
•
Color – a string representing the MATLAB color used for drawing the arc in the Drawing Area;
•
Weight – the weight of the arc.
The Probability tag has the following structure:
•
Transitions – the Ids of the conflicting transitions (separated by comma) subject to the probability assignment;
•
Values – the corresponding values of the firing probabilities (separated by comma); nonnegative values whose sum equals 1.
The Priority tag has the following structure:
•
Transitions – the Ids of the conflicting transitions (separated by comma) subject to the priority assignment;
•
Values – the corresponding values of the firing priorities (separated by comma); nonnegative values, 0 meaning the highest priority.
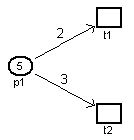
Example: The XML file corresponding to the PN model in fig. II.17 is given below.
Fig. II.17. The PN model used for illustrating the XML file-format.
<?xml version="1.0"?>
<PNToolbox>
<Model_name>XMLexample.xml</Model_name>
<Type>2</Type> <!-- T-timed PN -->
<Seed>66</Seed> <!-- initial seed -->
<Place> <!-- place definition-->
<Id>p1</Id> <!-- place’s id -->
<Value>5,43</Value> <!-- coordinates in the Drawing Area-->
<Color>black</Color> <!-- drawing color-->
<Label> <!-- information of the label-->
<Name>p1</Name> <!-- string label-->
<Offset>0.50,-0.20</Offset> <!-- the offset of the representation-->
<Visible>yes</Visible> <!-- the visibility of the label-->
</Label>
<InitialMarking>5</InitialMarking> <!-- initial marking of the place-->
<Capacity>Inf</Capacity> <!-- capacity of the place-->
</Place>
<Transition> <!—transition’s definition-->
<Id>t1</Id> <!-- transition's id-->
<Value>8,45</Value> <!-- coordinates in the Drawing Area-->
<Color>black</Color> <!-- drawing color-->
<Message>Firing transition t1</Message> <!-- message displayed when it is fired-->
<Label> <!-- information of the label-->
<Name>t1</Name> <!-- string label-->
<Offset>0.50,-0.20</Offset> <!-- the offset of the representation-->
<Visible>yes</Visible> <!-- the visibility of the label-->
</Label>
<Time> <!-- information for time distribution function>
<Distribution>constant</Distribution> <!-- constant distribution-->
<Parameters>3</Parameters><!-- duration equal to 3-->
</Time>
</Transition>
<Transition> <!-- second transition’s definition -->
<Id>t2</Id>
<Value>8,41</Value>
<Color>black</Color>
<Message>Firing transition t2</Message>
<Label>
<Name>t2</Name>
<Offset>0.50,-0.20</Offset>
<Visible>yes</Visible>
</Label>
<Time>
<Distribution>cont. uniform</Distribution> <!-- uniform distribution between 1 and 5-->
<Parameters>1,5</Parameters>
</Time>
</Transition>
<Arc> <!-- arc definition>
<Id>a1</Id> <!-- arc's id-->
<From>p1</From> <!-- departure node-->
<To>t1</To> <!-- arrival node-->
<Style>1</Style> <!-- regular arc-->
<Type>1</Type> <!—the graphic representation is a line -->
<Color>black</Color> <!-- drawing color-->
<Weight>2</Weight> <!-- arc's weight-->
</Arc>
<Arc>
<Id>a2</Id>
<From>p1</From>
<To>t2</To>
<Style>1</Style>
<Type>1</Type>
<Color>black</Color>
<Weight>3</Weight>
</Arc>
<Probability> <!-- probability for conflicting transitions t1 and t2; 25% for t1 and 75% for t2 -->
<Transitions>t1,t2</Transitions>
<Values>0.25,0.75</Values>
</Probability>
</PNToolbox>

