II.3.8. Scope
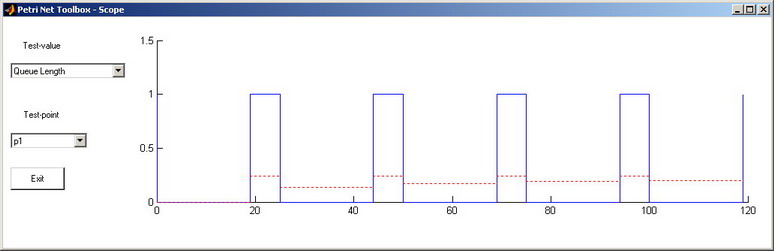
The Scope facility opens a new MATLAB window (fig. II.12) that displays (dynamically) the evolution of the selected performance index. Each index provides two types of information, namely a current value (that characterizes the PN at the current moment of the simulation) and a global value (that characterizes the whole evolution of the PN, as an average over the whole time-horizon from the beginning of the simulation till the current moment). For the selected performance index, both current and global values are plotted versus time.
The usage of the Scope facility is available only for timed PNs in the Step and Run Slow simulation modes.
Fig II.12. The Scope window.
The current/global performance indices displayed by Scope are:
-
for a transition:
•
Service Distance: means the duration between two successive firings of the selected transition;
•
Service Time: means the duration between the enabling and the firing of the selected transition;
•
Utilization: means the current status of the selected transition: 1 for the time-interval between the enabling and the firing of the selected transition; 0 otherwise;
-
for a place:
•
Arrival Distance: means the duration between two successive instants when tokens arrive in the selected place;
•
Throughput Distance: means the duration between two successive instants when tokens leave the selected place;
•
Queue Length: means the number of tokens in the selected place.
During a simulation experiment, only one of the six performance indices can be dynamically displayed by the Scope. The red color is automatically set for plotting the evolution of the global performance index. The blue color is automatically set for plotting the evolution of the current performance index. The final value shown by the Scope for the global performance index is identical to the value displayed on request, at the end of simulation, by accessing the Performance menu.

