II.4. Analyzing Simulation Results
II.4.1. Global Performance Indices
After simulation ends, the global performance indices described in the Scope section are stored by the PN Toolbox and can be visualized by using the Performance menu. Besides these, there are also a number of global indices for which the current values are not defined.
The following two tables present the complete lists of global indices associated with the places (displayed by the Place Indices command) and the transitions (displayed by the Transition Indices command), respectively:
-
for a transition:
•
Service Sum: total number of firings;
•
Service Distance: average value of the current index Service Distance;
•
Service Rate: average frequency of firings (inverse of Service Distance);
•
Service Time: average value of the current index Service Time;
•
Utilization: average value of the current index Utilization;
-
for a place:
•
Arrival Sum: total number of arrived tokens;
•
Arrival Distance: average value of the current index Arrival Distance;
•
Arrival Rate: average frequency of token-arrivals (inverse of Arrival Distance);
•
Throughput Sum: total number of departed tokens;
•
Throughput Distance: average value of the current index Throughput Distance;
•
Throughput Rate: average frequency of token-departures (inverse of Throughput Distance);
•
Waiting Time: average waiting time per token;
•
Queue Length: average value of the current index Queue Length.
These indices may be saved in HTML format in a file placed in the working directory.
II.4.2. Usage of the Distribution Fitting Tool
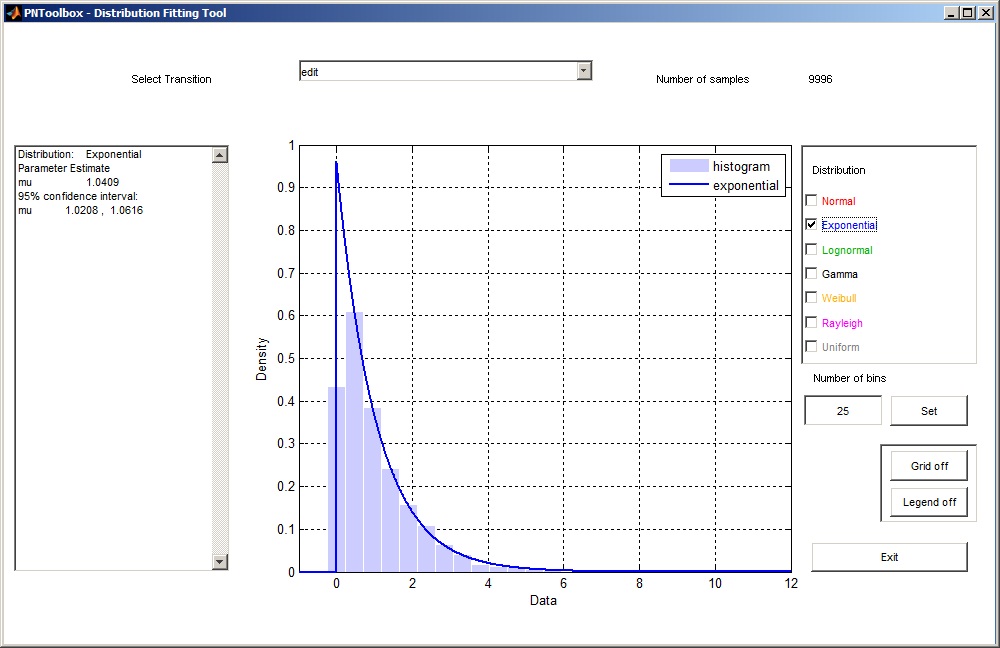
In the case when the option Keep Time from the Simulation menu has been used, after the end of the simulation, the Distribution Fitting Tool window can be opened by using the Fitting Tool command. This tool allows fitting some probability density functions to the saved data.
The user may choose between the exponential, lognormal, gamma, Weibull, Rayleigh, uniform and normal probability distributions. The estimated parameters and the corresponding 95% confidence interval are shown in the left side of the window.
Fig. II.13. Distribution Fitting Tool window.

