
II.5. Max-Plus Models
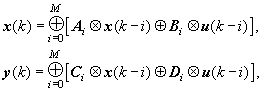
For place-timed event graphs, the PN Toolbox is able to directly derive the max-plus state-space representation from the topology and initial marking of a marked graph, in an implicit form:
where M denotes the maximal number of tokens
in the initial marking and N stands for the number of simulated iterations.
The components of the input vector 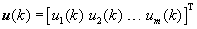 and those of the output vector
 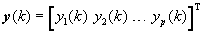 represent the k-th firing moments of the m source transitions
and of the p sink transitions, respectively. In a similar manner, the
state vector
represent the k-th firing moments of the m source transitions
and of the p sink transitions, respectively. In a similar manner, the
state vector 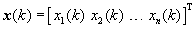 corresponds
to the n transitions in the net that have both input and output places
(i.e. those transitions which are neither sources nor sinks).
corresponds
to the n transitions in the net that have both input and output places
(i.e. those transitions which are neither sources nor sinks).
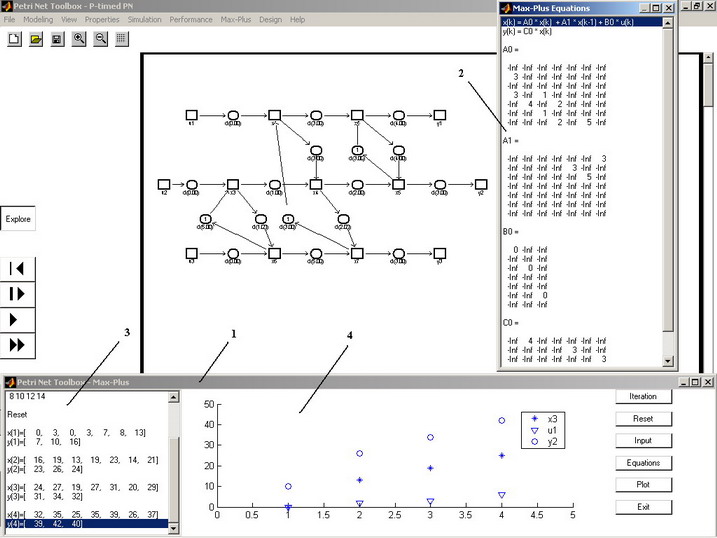
Fig. II.14. Facilities available in the PN Toolbox for max-plus analysis.
The max-plus model is automatically constructed by the PN Toolbox by using the Max-Plus menu. This command opens the Max-Plus window (denoted by (1) in fig. II.14) providing access to the following features available for max-plus analysis:
Ø
Equations button: displays the max-plus equations in a separate window (denoted by (2) in fig. II.14);
Ø
Input button: allows the user to set the values of the input vectors (time instants). This can be done (i) by introducing the time instants as a matrix with m rows and N columns directly in the dialogue box, or (ii) by creating the matrix input_time with the structure described above in MATLAB’s Workspace;
Ø
Plot: allows the user to select the components of the input, state or output vectors that will be plotted, by using vectors with components equal to 0 (enabled) or 1 (disabled);
Ø
Iteration: runs an iteration of the simulation at a time. The values of the state and output vectors are displayed in the Numerical Results box located on the left side of the Max-Plus window. The selected components are plotted;
Ø
Reset: resets the model to the initial state and clears the MATLAB axes;
Ø
Exit: closes the Max-Plus window and returns the control to the PN Toolbox GUI.
The Numerical Results box (located in the left side of the Max-Plus window, denoted by (3) in fig. II.14) displays the input vectors as well as information reflecting the stage of the analysis (the state and output vectors after each iteration).
In the MATLAB axes (denoted by (4) in fig. II.14) placed in the middle of the Max-Plus window, all the selected components are plotted. The components of the input, state and output vectors are plotted with the symbols , and , respectively. For two or more components of the same vector, different colors are used with the same symbol.

