II.1.2. Places
A place is graphically represented in the Drawing Area by a circle. To draw a place in the Drawing Area, the user must press the Add Place button from the Drawing Panel or select the Add Place command from the Modeling menu. Then, the user must click only once into the desired grid cell of the Drawing Area. A second click in the same grid cell has no effect.
Once the circle corresponding to a place is drawn, a label is automatically attached to it. The default position of the label is below the circle.
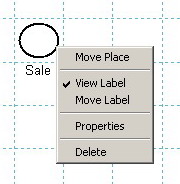
Fig. II.2. The uicontext menu of a place.
After drawing a place, there are two ways to change its position in the Drawing Area while in Draw Mode and no button from the Drawing Panel is pressed. The first way is to left-click the desired place and then drag it in the new position. The second way is to right-click the place; as a result, a MATLAB uicontext menu (fig. II.2) appears and the command Move Place becomes available. In both cases, the label is moved together with the place.
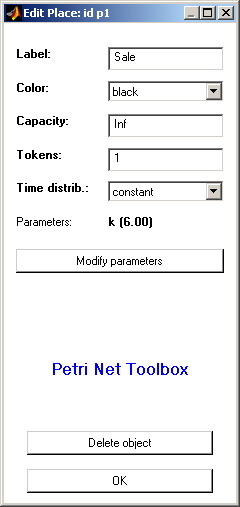
Fig. II.3. The Edit Place dialogue box for modifying the properties of a place.
For a selected place, the uicontext menu also allows: (i) controlling the label’s visibility on the screen (View Label command), (ii) changing the position of the label (Move Label command), (iii) deleting the place (Delete command) and (iv) opening the Edit Place dialogue box (fig. II.3) that lets the user modify the properties of the place as a MATLAB object (Properties command).
The Edit Place dialogue box may be also opened by one of the procedures (EP1) or (EP2) described below, followed by a click on the desired place. (EP1) consists in selecting the Edit Objects command from the Modeling menu; (EP2) consists in pressing the Edit Objects button from the Drawing Panel.
Each place is uniquely identified with an id that is automatically assigned by the PN Toolbox and cannot be changed by the user. This id appears in the title bar of the Edit Place dialogue box.
The option Label displays the string that is used as the label of the place. By default, this string coincides with the id of the place. The user can modify this string (without affecting the id) if necessary.
The option Color displays the color used for drawing the place. By default, this color is black, but the user can select another one from a list of eight predefined colors. Using different colors for drawing the places of a net might be helpful for complex topologies (e.g. for highlighting different phases requested by a multi-step design procedure).
The option Capacity displays the capacity of the place. By default, the capacity is Inf (the IEEE arithmetic representation for positive infinity). The user can set this field to a positive integer value.
The option Tokens displays the number of tokens in the place. By default, this number is 0. The user can set this field to a positive integer value. If the marking of a place is greater than 0, this marking is shown as a number inside the circle corresponding to that position. Void marking is not explicitly shown.
There are two more possibilities to add a token to a place (AT1) or (AT2) described below, followed by a click on the desired place. (AT1) consists in selecting the Add Token command from the Modeling menu; (AT2) consists in pressing the Add Token button from the Drawing Panel.
In case of place-timed PN models (see section P-timed Petri nets), the Time distribution option associated with a place allows the user to specify the probability distribution and the necessary parameter(s) which define the corresponding time-duration. This option is not available for untimed or transition-timed models.
The Delete object button placed at the bottom of the Edit Place dialogue box lets the user delete the place from the model.

